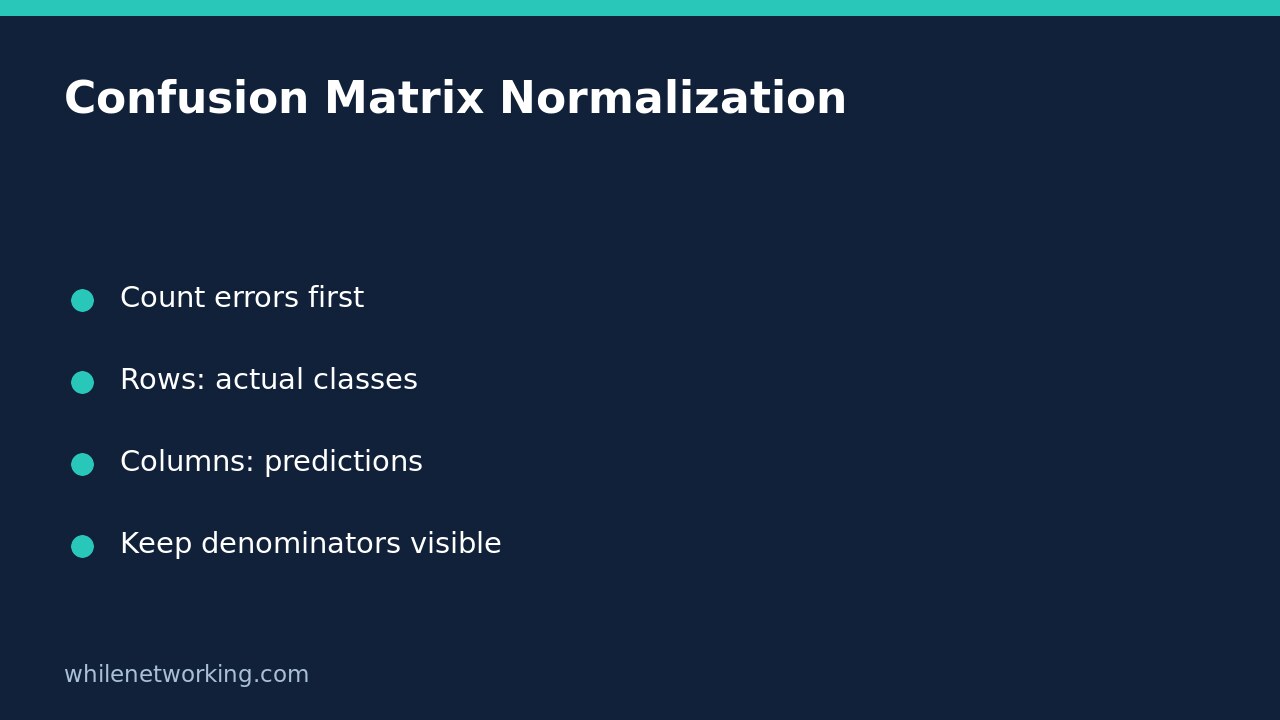

In scikit-learn, use normalize='true' to read a confusion matrix as proportions within actual classes, and normalize='pred' for proportions within predicted classes. These answer different questions. A bright diagonal cell without an identified denominator can be misleading, even when the calculation is correct.
This beginner exercise uses invented labels and predictions, not a trained production model or measured business result. It makes no network requests and changes no application data. You need Python and scikit-learn in an isolated practice environment. If the import fails, use your normal approved environment setup rather than modifying a shared system interpreter.
Establish the axes before choosing normalization
The official confusion_matrix reference defines row i as the true class and column j as the predicted class. Keep that convention explicit in notebook titles and charts. Other sources can use different orientations, so do not transfer an interpretation just because two plots look similar.
Start with raw counts. They reveal sample size and make it possible to distinguish a large error group from a proportion based on very few observations. Normalized output is useful alongside counts, not as a replacement for them.
Run a small count-first example
Save this as a disposable Python file or run it in a fresh notebook cell. The fixed class order makes the displayed axes easy to follow. It does not solve problems with incorrectly paired records: each prediction still needs to correspond to the same observation as its true label.
from sklearn.metrics import confusion_matrix

y_true = [0, 0, 0, 0, 1, 1]
y_pred = [0, 0, 0, 1, 0, 1]
labels = [0, 1]

for mode in [None, 'true', 'pred', 'all']:
    matrix = confusion_matrix(
        y_true, y_pred, labels=labels, normalize=mode
    )
    print('normalize =', mode)
    print(matrix)
Read the unnormalized matrix first. Its rows should be [3, 1] and [1, 1]. There are four actual class-zero examples and two actual class-one examples. The off-diagonal cells represent different error directions; do not merge them before deciding which mistake matters for your task.
Use row normalization for actual-class outcomes
With normalize='true', each nonempty row is divided by its own total. The first row becomes [0.75, 0.25], while the second becomes [0.5, 0.5]. Ask: among observations that really belong to this row’s class, how were they predicted?
The class-one diagonal is therefore recall for class one: the model found half of the actual class-one examples in this toy dataset. This view is helpful when investigating missed positives or unequal success across actual classes. Keep the count beside the proportion, because half of two observations is not strong evidence of stable performance.
Use column normalization for prediction composition
With normalize='pred', each nonempty column is divided by its own total. Ask: among observations predicted to belong to this column’s class, which actual classes did they come from? The diagonal describes precision for the corresponding predicted class.
This particular example has equal actual and predicted class totals, so row-normalized and column-normalized arrays happen to match. That coincidence does not make their meanings interchangeable. As a second exercise, change only the final prediction from one to zero and rerun. Now compare both denominators before interpreting the changed arrays. Retain the original example so you can revert the exercise easily.
Use whole-matrix normalization for overall shares
normalize='all' divides counts by the total number of observations. Each cell becomes its share of the whole evaluated set. This can describe how common an error is overall, but it is not the same as recall within a class or precision within a prediction group.
When comparing datasets, check whether class prevalence changed. A small overall error share can coexist with poor performance on a rare class. Compare against a sensible baseline using our DummyClassifier baseline tutorial rather than assuming a neat plot establishes usefulness.
Review checklist and common questions
- Label actual and predicted axes and record class order.
- Preserve raw counts and identify the denominator in the caption.
- Check that observations and predictions are aligned.
- Investigate empty rows or columns before making conclusions.
- Do not tune repeatedly against a final held-out test set.
Why can a class look perfect? A tiny sample can produce an impressive proportion. Inspect support and use appropriate validation.
Should I also print a report? The official classification_report documentation describes precision, recall, F1 and support. Use it to complement the matrix, while checking undefined metrics rather than hiding their cause.
This tutorial is for educational purposes. Test carefully before production use. The site owner is not responsible for misuse, damage, data loss or production issues.