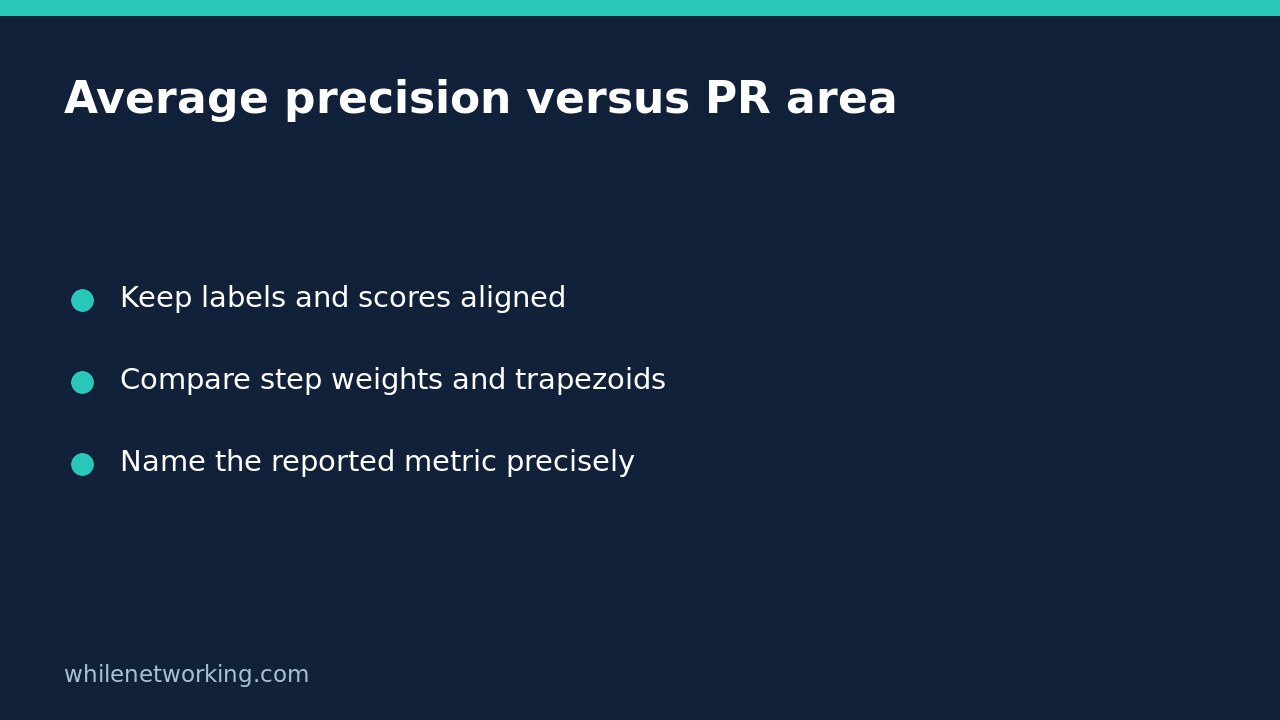

Average precision and trapezoidal area under a precision-recall curve can give different numbers for the same predictions. In scikit-learn, average_precision_score weights precision by increases in recall; it does not linearly interpolate between curve points. If a report says only PR AUC, ask which calculation produced the value before comparing experiments.
This matters when a dashboard, notebook and monitoring report appear to disagree despite using identical labels and scores. The first investigation should be the metric definition, not a new model fit. The following small example isolates that distinction without downloading data or training an estimator.
Start with a fixed positive class and ranked scores
Use a binary target where one means the event of interest. Supply continuous scores whose larger values indicate stronger evidence for that event, not thresholded class predictions. Keep each score paired with its original label: sorting one array independently changes the question and invalidates the result.
Our deliberately tiny fixture has two positive observations among four rows. Their scores are interleaved with negatives, so precision changes at meaningful recall steps. This is a teaching example, not evidence about a production classifier or a recommendation for an acceptable score.
Calculate both summaries on exactly the same observations
Run this in a disposable Python environment with scikit-learn installed. The script prints both summaries and asserts the expected values. It does not fit a model, choose a decision threshold or change any files.
from math import isclose
from sklearn.metrics import (
    auc, average_precision_score, precision_recall_curve
)

y_true = [0, 1, 0, 1]
y_score = [0.1, 0.4, 0.35, 0.8]

ap = average_precision_score(y_true, y_score, pos_label=1)
precision, recall, thresholds = precision_recall_curve(
    y_true, y_score, pos_label=1
)
pr_area = auc(recall, precision)

print(f"Average precision: {ap:.6f}")
print(f"Trapezoidal PR area: {pr_area:.6f}")
assert isclose(ap, 1.0)
assert isclose(pr_area, 1.0)

# Move a negative above one positive to expose the difference.
y_score = [0.1, 0.35, 0.4, 0.8]
ap = average_precision_score(y_true, y_score, pos_label=1)
precision, recall, thresholds = precision_recall_curve(
    y_true, y_score, pos_label=1
)
pr_area = auc(recall, precision)
print(f"Interleaved average precision: {ap:.6f}")
print(f"Interleaved trapezoidal PR area: {pr_area:.6f}")
assert isclose(ap, 5 / 6)
assert isclose(pr_area, 19 / 24)
The first ranking places both positives above both negatives, so both summaries equal one. The second ranking places a negative between the two positives. Average precision is approximately 0.833333, while trapezoidal area is approximately 0.791667. Agreement on the first fixture alone would therefore have hidden the distinction.
Understand the weighting instead of repairing the number
In the second ranking, retrieving the highest-scoring positive reaches recall one-half with precision one. Retrieving the other positive reaches recall one with precision two-thirds. Average precision gives each of those recall increases a weight of one-half: half of one plus half of two-thirds equals five-sixths.
The trapezoidal calculation instead connects the returned precision-recall points with straight lines. That is a different summarisation rule. The official documentation warns that linear interpolation can be too optimistic; that does not mean its result must exceed average precision on every dataset. This example deliberately shows why the definition matters more than an assumed direction of difference.
Do not reverse arrays, remove inconvenient points or change the averaging setting just to force agreement with a dashboard. First reproduce the dashboard’s exact definition and preprocessing on a saved evaluation fixture.
Make the report reproducible
- Record the positive label, evaluation population and scoring direction.
- Name the function and library version, rather than writing an unexplained PR AUC heading.
- Record sample weighting and any multiclass or multilabel averaging separately; this example is binary.
- Keep the evaluation split unchanged while comparing definitions.
- Retain a small interleaved fixture that distinguishes the implementations.
For deployment decisions, a ranking summary does not replace precision and recall at an operational threshold. Read the related tutorial on row and column confusion-matrix normalization when checking the actual mistakes made by thresholded predictions.
Quick questions and source
Can I compare two models? Yes, using the same defined metric, population and evaluation procedure. A difference between two formulas is not itself a model improvement.
Is average precision a calibration test? No. A ranking summary alone does not establish that predicted probabilities match observed event frequencies.
Source: scikit-learn’s average precision documentation, including its recall-weighted definition and interpolation warning.
This tutorial is for educational purposes. Test carefully before production use. The site owner is not responsible for misuse, damage, data loss or production issues.