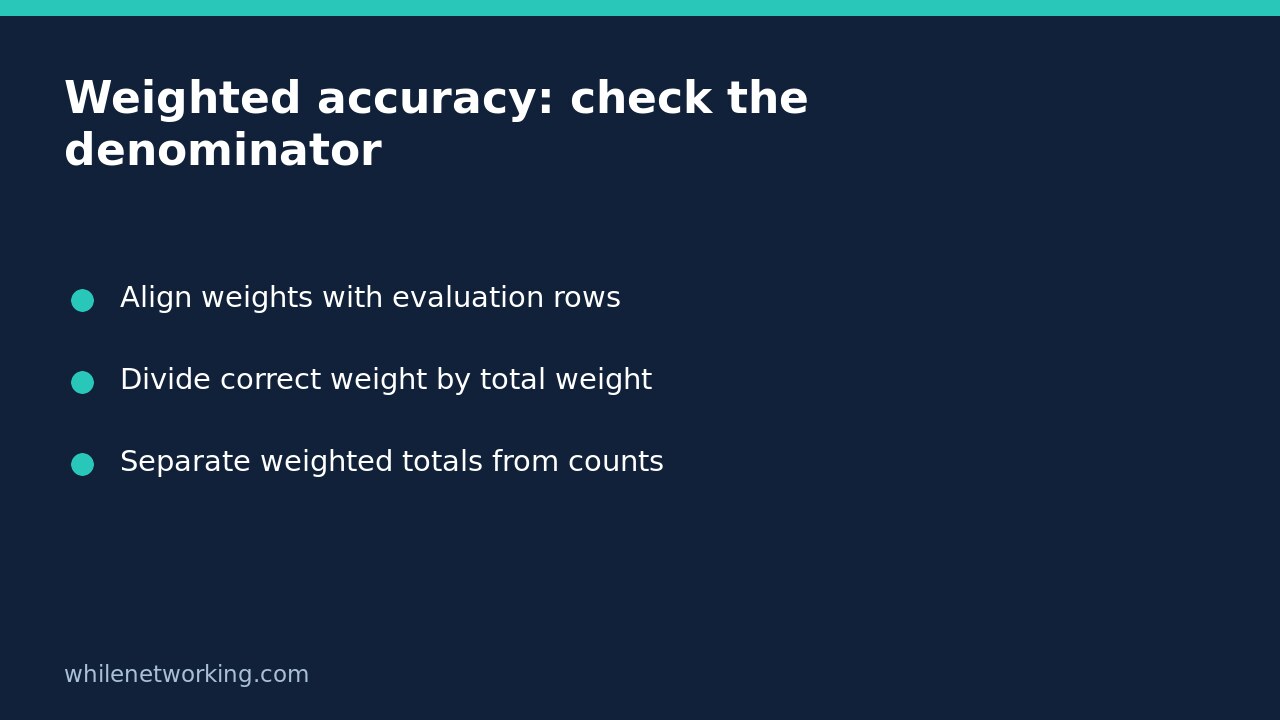

When accuracy_score receives sample_weight, its normalized result measures the fraction of total sample weight assigned to correct predictions. It is not necessarily the fraction of rows predicted correctly. With normalize=False, it returns the sum of weights for correct predictions, not necessarily an integer count. Keep those two denominators visible when reviewing an evaluation report.
Start with an example where the results disagree
Suppose four evaluation rows have three correct predictions. Give the single incorrect row a weight of six, while the other rows have weights one, two and one. Ordinary accuracy is three divided by four. Weighted accuracy is four divided by ten. These describe the same predictions under different evaluation priorities; neither result means the predictions changed.
The following is a deliberately invented teaching fixture, not a measured production result. Run it in a development environment where scikit-learn is already installed.
from sklearn.metrics import accuracy_score

y_true = [0, 1, 1, 0]
y_pred = [0, 0, 1, 0]
weights = [1, 6, 2, 1]

ordinary = accuracy_score(y_true, y_pred)
weighted = accuracy_score(y_true, y_pred, sample_weight=weights)
correct_weight = accuracy_score(
    y_true, y_pred, sample_weight=weights, normalize=False
)
scaled_weights = [10 * w for w in weights]
scaled_score = accuracy_score(y_true, y_pred, sample_weight=scaled_weights)
scaled_total = accuracy_score(
    y_true, y_pred, sample_weight=scaled_weights, normalize=False
)

assert ordinary == 0.75
assert weighted == 0.4
assert correct_weight == 4.0
assert scaled_score == weighted
assert scaled_total == 40.0
print(ordinary, weighted, correct_weight, scaled_score, scaled_total)
The expected printed values are 0.75 0.4 4.0 0.4 40.0. Multiplying every weight by the same positive factor leaves the normalized ratio unchanged. It changes the unnormalized total. A report calling that last total ’40 correctly classified records’ would be wrong: the fixture still contains only four records.
Check weight alignment before interpreting the score
Each evaluation weight belongs to one row. Keep the true label, prediction and weight together through filtering, sorting and joining. Matching array lengths is necessary but does not prove matching row order. For a real dataset, retain a stable row identifier and inspect a small table containing that identifier, the true label, prediction and assigned weight.
Use finite, nonnegative weights with a positive total for this interpretation. Treat zero-weight rows as contributing nothing to the weighted result, not as records that disappeared from the evaluation dataset. State how many such rows exist. If weights were generated upstream, inspect their range and largest contributors before trusting a headline percentage; a small number of heavily weighted errors can dominate the result.
Separate evaluation weighting from model training
Passing weights to the metric does not retrain the estimator. It changes how the supplied predictions are summarized. An estimator’s training weights, if supported, are a separate input to its fitting procedure. Document which stage used which weights rather than describing an entire experiment as simply ‘weighted’.
Choose evaluation weights for a stated purpose before comparing candidate models. Do not adjust them after seeing which model wins just to improve the headline. When comparing two runs, hold the evaluation rows, weights and label interpretation constant. Otherwise, a score difference may reflect a changed evaluation population rather than an improved classifier.
Do not confuse sample weighting with balanced accuracy
Balanced accuracy summarizes recall across classes. Arbitrary sample-weighted accuracy is not automatically that metric, even if someone informally calls the weights ‘balanced’. Explain how weights were constructed and name the actual function used. A weighted score also does not reveal which class supplied the errors.
Inspect a confusion matrix alongside the headline. Our tutorial on row and column normalization of confusion matrices explains another place where a changed denominator changes the question being answered. Keep the unweighted row count in your report even when a weighted metric is the primary measure.
Review checklist and common questions
- Record the number of rows and the sum of evaluation weights separately.
- Identify the weighted correct total and the normalized score with different labels.
- Check that row alignment survived preprocessing.
- Use the same evaluation weights across model comparisons.
Does 0.4 mean only 40% of rows were correct? Not in this fixture. It means 40% of the total evaluation weight belongs to correct predictions; 75% of rows were correct.
Can I format the weighted total as an integer? Only if that presentation is appropriate for the weights, and never label it as a physical row count without justification. Fractional weights can produce fractional totals.
Sources: The official accuracy_score reference documents normalization and sample weights. The upstream implementation shows the correctness indicator being aggregated with those weights; the development branch may differ from your installed release.
This tutorial is for educational purposes. Test examples before production use. The site owner is not responsible for misuse, damage, data loss or production issues.